Marketing guide

Reading the results: from the starting point to today

Reading the results of a plan

by Published on Updated on 6 min readFree, no sign-up required

Key points

  • Starting point, today, forecast to date, variance and projection.
  • On track, warning, critical or no data: the status is clear at a glance.
  • No data means measurement is missing, and that is already a problem.
  • Before reacting, check the data and seasonality.
  • The plan is updated based on results, not forgotten.

The five figures of every KPI

  • Starting point: where we were before the plan (for totals, scaled to the same number of days).
  • Today: where we are now (cumulative since the start of the plan, or current level).
  • Forecast to date: where, according to the plan, we should be right now.
  • Variance: how far above or below the forecast we are, as a percentage.
  • Projection: where we would end up at the close of the plan if the pace stayed the same.

The colours

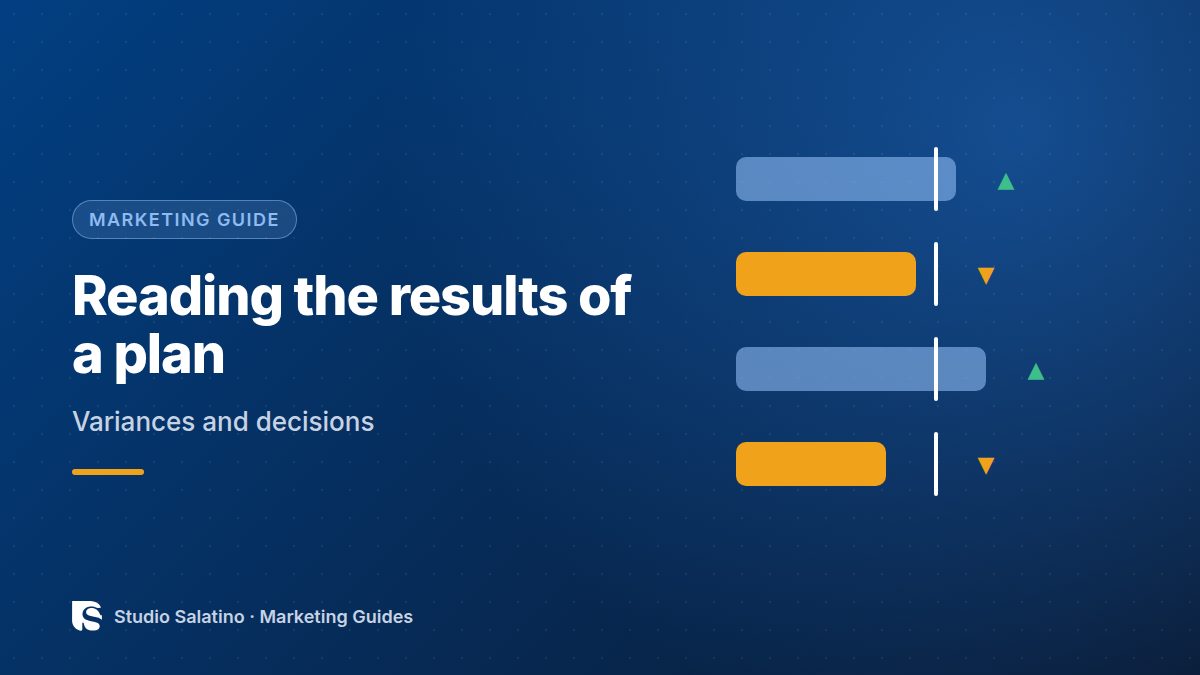
On track or achieved: the KPI is going as forecast. Warning: it is below forecast but recoverable. Critical: the variance is large and action is needed. No data: measurement is missing, which is already a problem to solve.

An example

A 12-month plan, and we are in month five. Enquiries: starting point 300 (125 in the first 5 months of last year), today 190, forecast 165 → +15%, on track, projection 456 against a goal of 420. Conversion rate: starting point 2.1%, today 2.4%, forecast 2.5% → slightly below, so we look at where people are dropping off.

What to do about a variance

  • Check the data: is the source complete? Is the period comparable?
  • Look at seasonality: a dip in a weak month may be normal.
  • Look for the cause: which channel or action is behind schedule?
  • Decide together: reinforce, adjust or postpone. The plan gets updated, not forgotten.
Frequently asked questions

How do you read a KPI’s variance?

It is the percentage difference between today’s value and the value the plan expects by today: it shows whether you are ahead of or behind the pace needed to reach the target.

What is the end-of-plan projection?

The estimate of where the KPI will end up at the close of the plan if the current trend continues, to be compared with the target.

What should you do if a result is below forecast?

Check that the data are complete and comparable, take seasonality into account, look for the cause and decide whether to reinforce, adjust or postpone the action.

Terms in this guide

Full glossary →

First step

Let’s apply it to your business

Every partnership starts with a conversation. The first two steps are free and with no obligation: they help us understand whether our method is right for your business.

  1. 1
    Fill in the requestOne minute: your name, company and how to reach you.
  2. 2
    Activate your accessAn email with a button takes you to the client area. Then the consultant sends you the discovery questionnaire: about 10 minutes, even in several sittings.
  3. 3
    Free discovery callA 45-minute video call with the consultant to see whether and how we can help you.

Prefer to write to us? info@studiosalatino.com

Step 1 of 3 Request · then questionnaire (10 min) · then free call (45 min)

Right after sending, you receive an email with a button to activate your access to the client area. Then the consultant sends you the discovery questionnaire (about 10 minutes, even in several sittings) and you schedule the free 45-minute discovery call.

Book your free discovery call